


Subscriber,
First the numbers:
The rotation out of huge tech stocks accelerated last week. While the S&P 500, more or less a proxy for the so-called Magnificent 7, rose just 0.6%, our index of 152 investables gained 1.4%. (As I wrote a while back, the rotation will not be into small stocks per se, but rather into non-huge profitable stocks with risk premiums; therefore, I’ll use our index going forward rather than the Russell 2000 or S&P 600, which both include lots of zombies.) Collectively, our wallflowers and cigar butts have gained 8.7 percent since July 1st, including most dividends, while the S&P 500 has gained 5.0 percent over the same time period. Our index’s annualized rate of return, including most dividends, will be around 40 percent in its first full quarter, which ends tomorrow at four p.m.. (The full index is available to paid subscribers in Excel format, upon request.)
Now the commentary, plus some other numbers:
According to historians, September was supposed to be a terrible month for stocks. Also, Donald Trump was supposed to be ahead in the polls and Israel was supposed to have a far harder time cracking Hezbollah than Hamas. So my birthday month has been a bad month for conventional wisdom, and therefore pretty great for yours truly and other intelligent investors, not to mention proponents of democracy.
The media, per tradition, failed to take notice of its failed narratives. For example, it was widely reported early last week that consumer confidence had “plunged” to a three-year low this summer; then a couple of days later The Wall Street Journal reported that “Optimism about the economy is sweeping markets from stocks to bonds and options.” So either journalists have remarkably short memories or else the decoupling of the financial markets and the consumer economy is reaching a tipping point. My bet is on the latter, even if (though not because) such a decoupling, which we last experienced in extremis in 2008-9, is foreboding. According to Statista, Americans have accumulated $100 trillion dollars in debt, which is balanced atop a $25 trillion economy. This does not include future government liabilities like pensions and other entitlements, which would bring the total national debt to over one quarter of a quadrillion dollars—i.e. one thousand percent of GDP.
And the scariest part is that the financial economy is still growing far faster than the real (consumer) one. Even Costco, which used to reliably grow sales in the double digits, is squeaking out annual gains of just 5% growth at the store level and around 9% overall. Most of the companies that have released earnings lately seem to be in contraction mode, including auto sales giant CarMax, which has also seen a deterioration in the quality of its loan portfolio. Coincidence? I don’t think so.
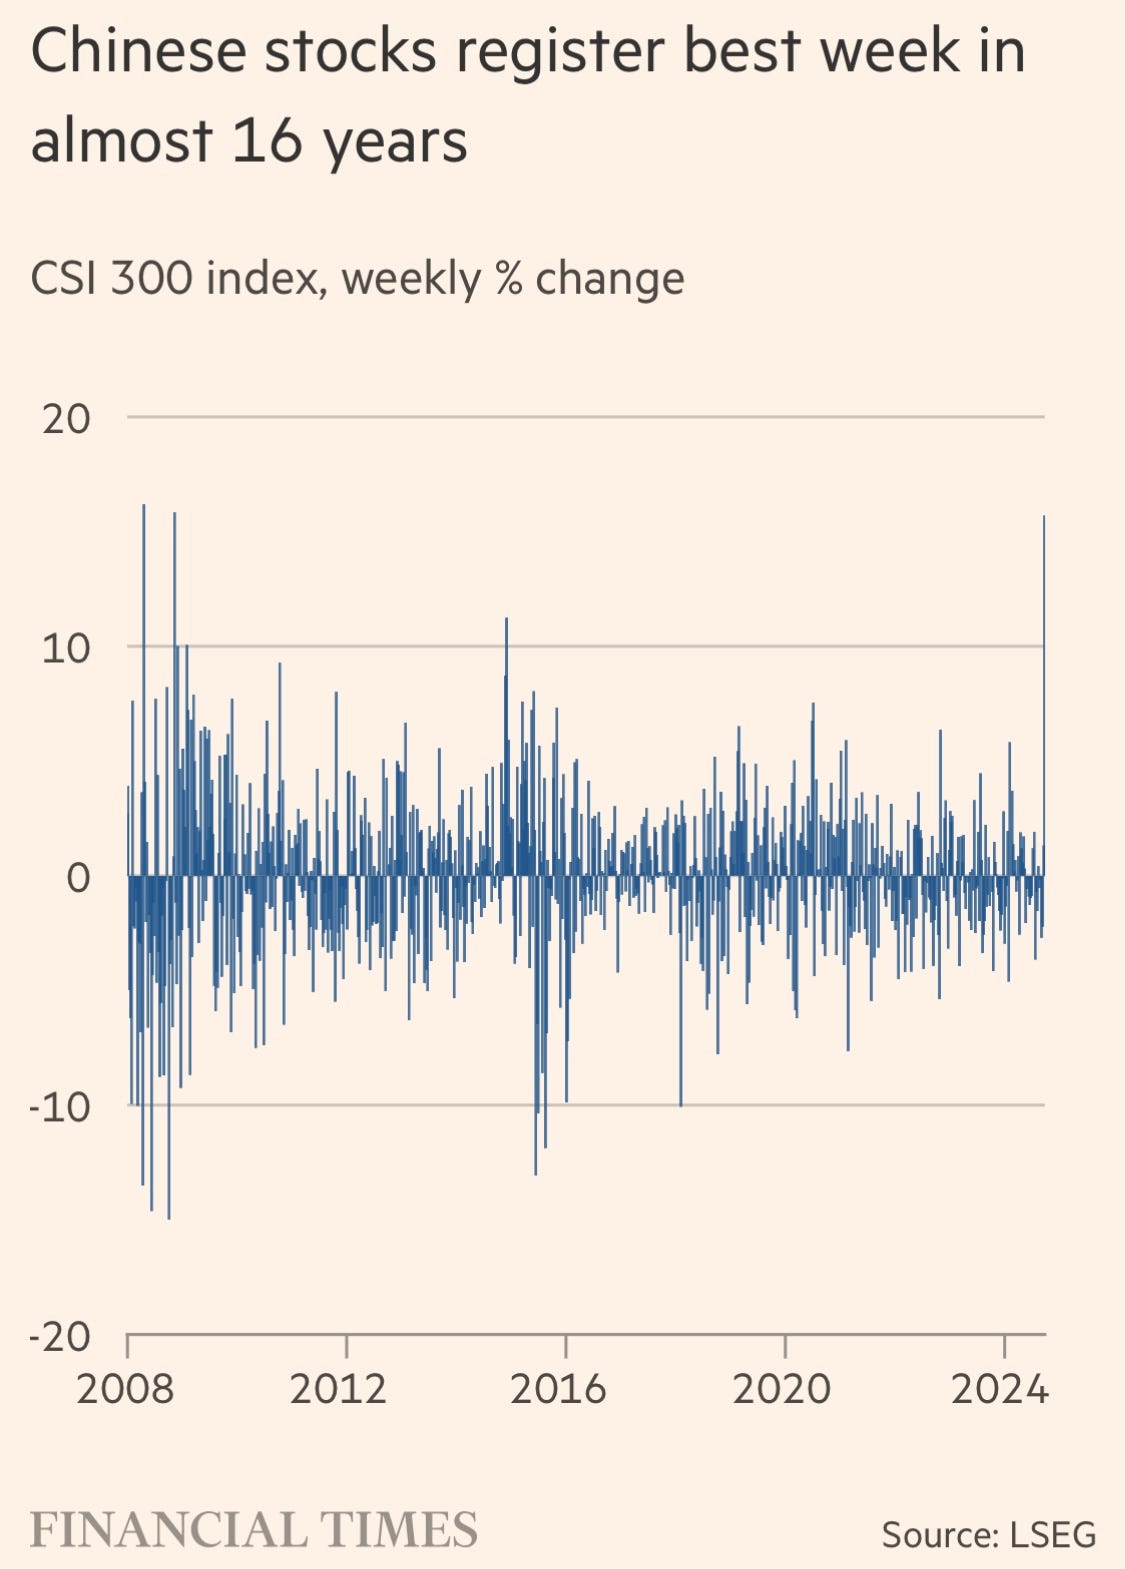
But stocks inched ahead anyway last week and China boomed (see above). With world leaders gathered in New York City to make their speeches at the UN last week, I’d hope to learn whether China is now considered a competitor, an adversary, an enemy, a frenemy or something else, like an election year straw man for example. But all I know (still) is that Chinese markets have benefited far more from the Fed’s easing than our own. The relevant question to the investor is whether these gains are sustainable, and the answer is probably yes, since most investors still clamor for economic growth. Indeed, if our $100-250 trillion-plus in debt and future obligations are to be honored, Americans are going to have to invest in growth, wherever it is.
A couple of headlines from South China Morning Post and the FT, respectively:

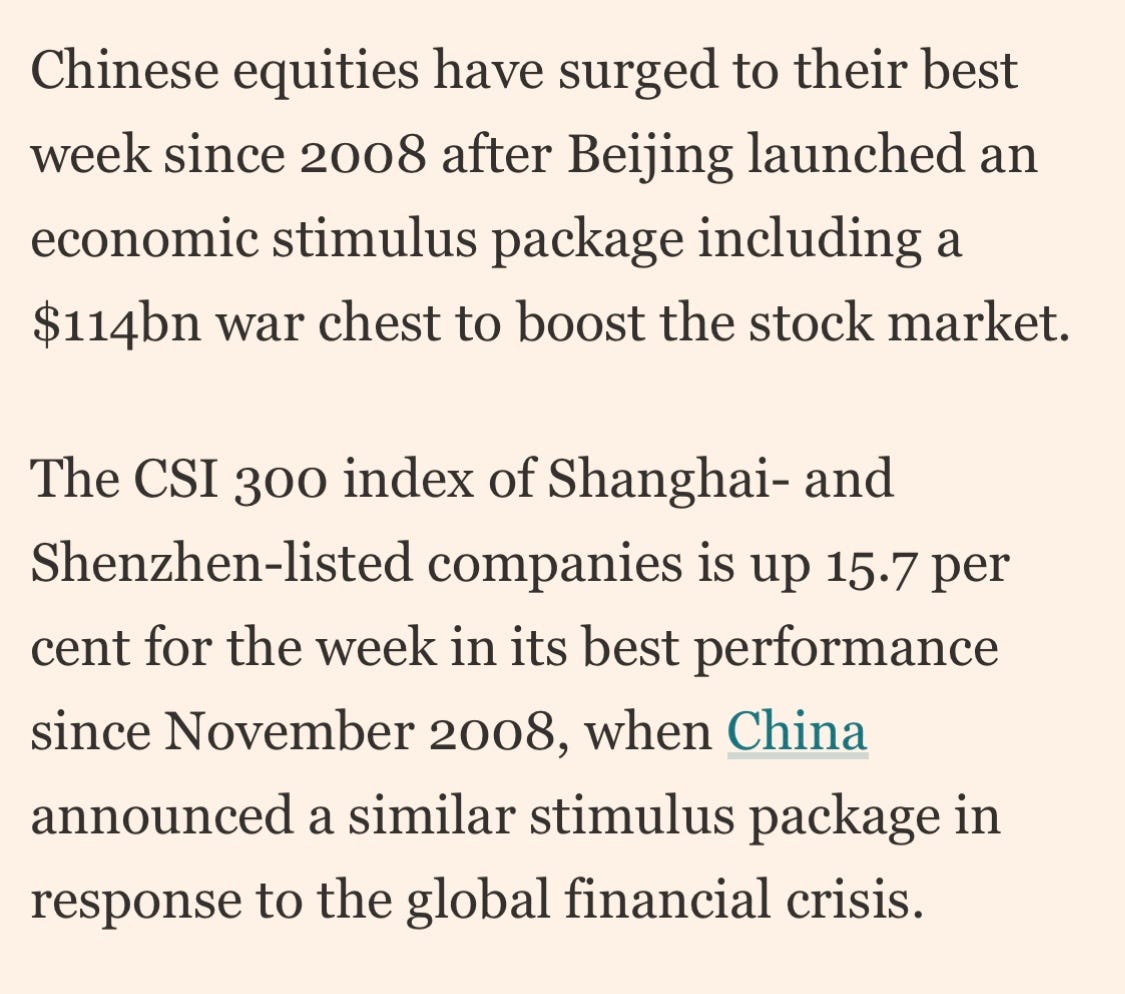
A house divided against itself cannot stand, but I’m pretty sure that a world divided still spins. I’m sticking with my Chinese stocks, which have done very well for the Fund. And not just because of China’s commitment to growth, or even primarily because of it, but rather because the Chinese market seems like a bargain. Hong Kong’s Hang Seng Index, for example, trades at eleven times earnings, a yield of about 9%; while the S&P 500 fetches just under 30 times earnings, a yield of just over 3%.
Is a dollar of American-based earnings really worth three times that of its Hong Kong-based counterparts? That’s for the markets to decide, I suppose, but behind every mispriced asset (or market) there is a false or overdone narrative, and so it is in this case, i.e. that the United States and its military allies will contain China’s economy. This narrative has taken hold even as it has proved a non-sequitur. Indeed, the more tariffs and trade restrictions imposed upon it, the more resilient the Chinese economy seems to become, both in terms of technological development and exporting. Which leaves the nuclear option—i.e. restricting Americans from investing in China—to keep the containment narrative alive. But would a ban on new investment really hurt China’s economy or simply put a damper on its stock market? Or might it have the opposite effect than intended, by fomenting domestic support for Chinese stocks as trade restrictions have fomented demand for domestic brands like Huawei and Luckin? I don’t know. But the narrative that the US can or will control the growth of Chinese companies, and by extension the Chinese economy, is clearly flawed.
Another false narrative involves the cheapest stock in our index: TTEC Holdings (see below). TTEC is a global customer experience (CX) outsourcing company, meaning that a lot of its business is running customer contact centers in countries where labor is cheap and command of the English language is less than pristine. The narrative is thus: Generative AI agents and chatbots will soon replace human beings, making TTEC and its peers irrelevant and OpenAI the most valuable company of all time. Yet companies, including OpenAI backer Microsoft, have shown a reluctance to have AI interact with both employees and customers, and for obvious reasons. Does the disconnect between AI narrative and reality make TTEC a bargain? Not necessarily, but probably.
Speaking of the index, I promised to track the performance of our top 25 lists from a couple of weeks ago, the intention being to discern which strategy performed better over time—price, momentum or negative momentum. The first results will come out next week after the quarter’s end. From then on, results will be published monthly. I don’t know what we’ll learn but it feels good to be using our own index again rather than the usual suspects you see on CNBC. They’ve grown from useful benchmarks to insanely popular ETFs and in the months and years ahead, they should make terrific case studies in the demise of passive investing. Like the economy itself, they have become top-heavy and the law of gravity says that they must collapse of their own weight.
And maybe then we will learn a timeless lesson once more: that just as there is nothing artificial about intelligence, there is nothing passive about investing. How’s that for a narrative?
James
INVESTABLES
TOP 25 LISTS:
I. The Cheapstakes (based on Quantitative Value (QV) as a percentage of Friday’s closing price):
II. The Biggest Losers (based on percentage change in price since July 1st, i.e. the beginning of the rotation:

III. The Momentums (also based on percentage change in price since July 1st, i.e. the beginning of the rotation):
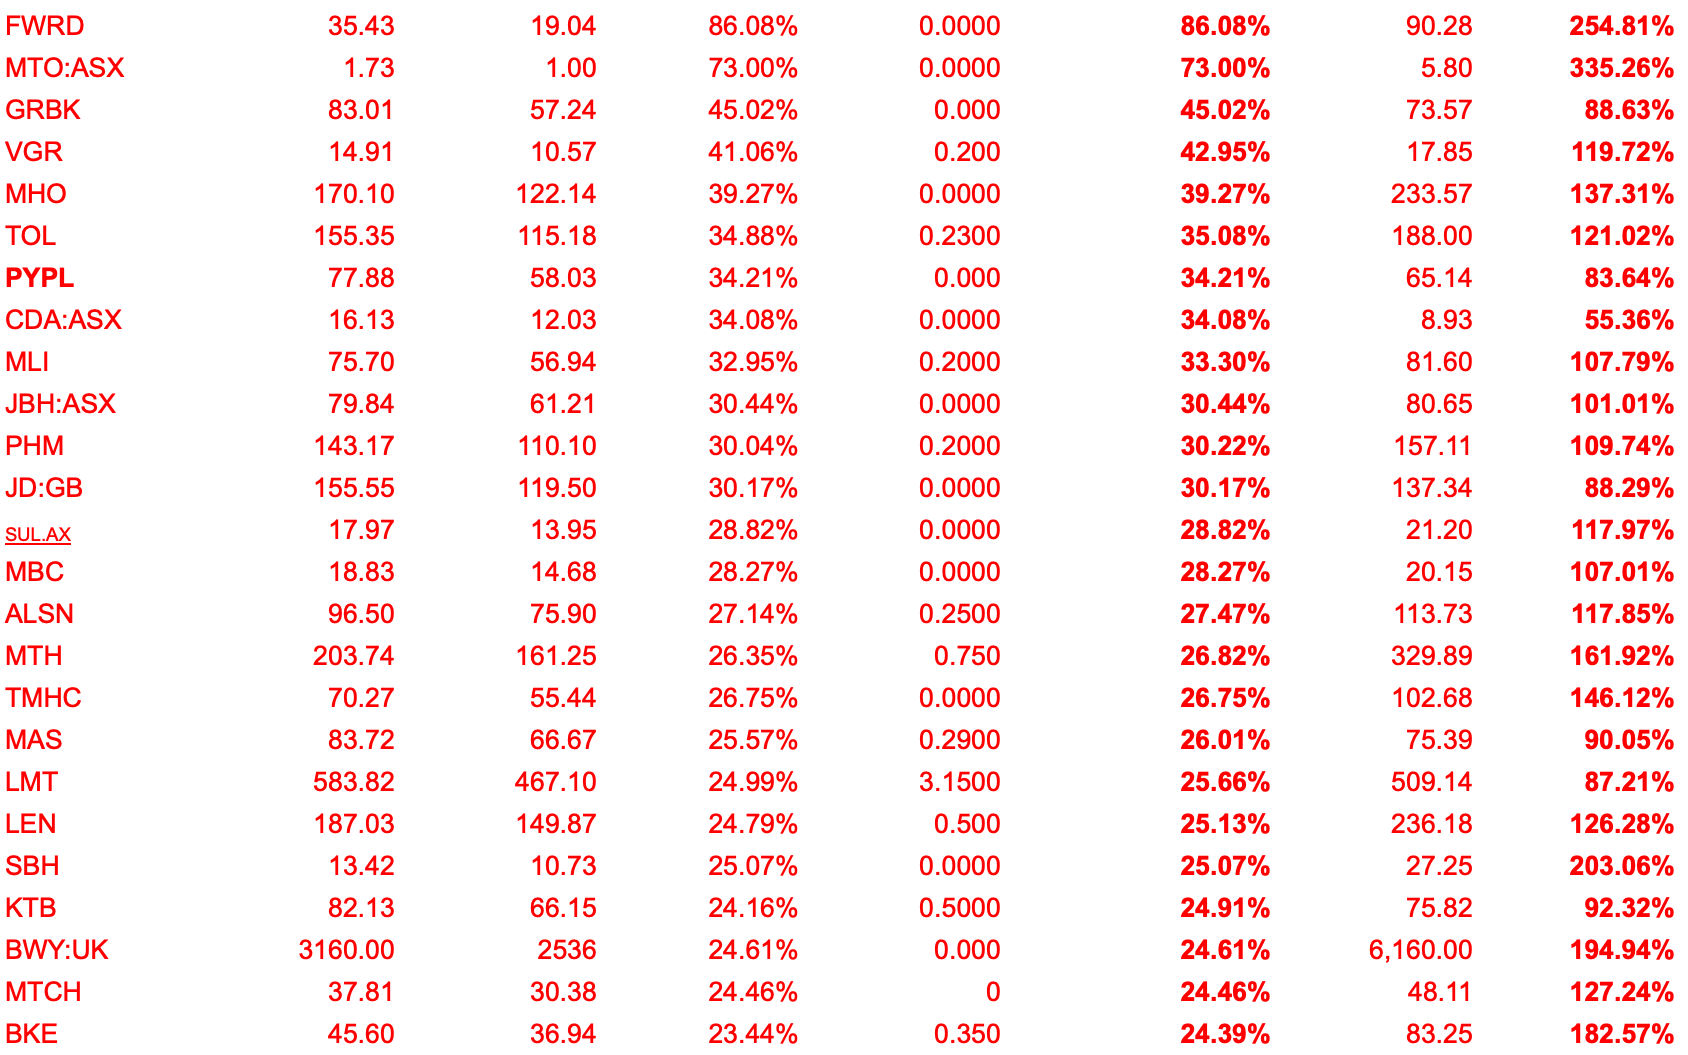
* UK and GB denote issues listed on the London Stock Exchange. ASX denotes an issue listed on the Australian Stock Exchange. All others are listed on the New York Stock Exchange or the NASDAQ.
THE 200% CLUB: Stocks whose quantitive value are at least twice (200% of) their market price as of Friday’s close:

There are no “fresh” cigar butts or wallflowers this week.
52-Weeklings
There are no cigar butts and/or wallflowers among the four US-listed companies trading at 52-week lows this weekend.
WARNING: GRAPHIC CONTENT!


this is the end.